
The Fibonacci indicator will work very well when market conditions are trending.
do a go-long (buy order) on the retracement at the Fibonacci support level when the trend is moving up, and do a go-short (sell order) on the retracement at the Fibonacci resistance level when the trend is moving down.
Finding Fibonacci retracement levels
To determine these Fibonacci retracement levels, you must find the most recent significant Swing Highs and Swing Lows.
Click Swing High and hover over the most recent Swing Low during a down-trend.
When an up-trend, do the opposite. Click Swing Low and hover over the most recent Swing High.
Understood?
Now, let's look at some examples of how to use Fibonacci retracement levels at market rates.
Uptrend
This is the daily chart of AUD/USD

Here we set the Fibonacci retracement level by clicking on the Swing Low 0.6955 point on April 20 and then dragging the cursor to the Swing High point 0.8264 on June 3rd.
The software will magically show you the retracement levels.
As seen above the chart, the Fibonacci retracement levels are 0.7955 (23.6%), 0.7764 (38.2%), 0.7609 (50.0%), 0.7454 (61.8%), and 0.7263 (76.4%). ).
Now, the expectation is that if AUD/USD retraces from its recent highs, we will find support at one of the Fibonacci retracement levels, where traders will place an open buy at this level after adjustment. Now, let's see what happens after the Swing High is clicked.
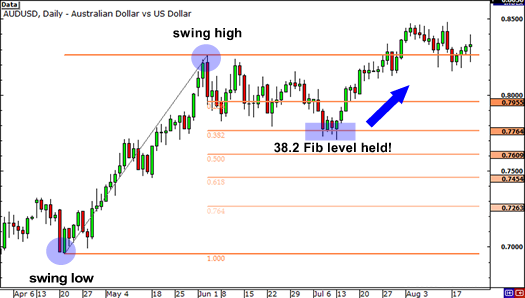
The price adjustment returned to 23.6% and continued to move downwards for the next few weeks.
It was seen that the price tested the 38.2% level several times, but failed to close above that level.
Then, on July 14th, the price rose again and finally broke through the Swing High.
It is very clear that if you open buy in the 38.2% level, you will make a profit.
downtrend
Then how to use the Fibonacci retracement indicator during a downtrend. Below is a 4 hour chart for EUR/USD

As seen above, the Swing High was at 1.4195 on January 25 and the Swing Low was at 1.3854 a few days later on February 1.
The retracement levels are 1.3933 (23.6%), 1.3983 (38.2%), 1.4023 (50.0%), 1.4064 (61.8%) and 1.4114 (76.4 %).
If the price is traced from a support point, it is likely to meet a resistance point at one of the Fibonacci levels. Where traders want to execute during a downtrend, they will be ready to set a sell order at that point at the best price.
Watch what happens next.

The price is testing for consolidation, stalled briefly below the 38.2% level before finally testing the 50% level
If you place an order at the 38.2% or 50% level, you will earn an insane number of pips.
In the two examples above, we can see that the price found some temporary support or resistance at the Fibonacci retracement level.
Because many people use the Fibonacci indicator, these levels will self-fulfill as support and resistance levels.
One thing to note is that the price does not always bounce from this level. Should be viewed as an area of interest, We will discuss this later.
For now, what you have to remember when using the Fibonacci indicator is not an easy thing to use!
If it were that easy, traders would always place orders at the Fibonacci retracement levels and the market would be trending forever.
In the next lesson, we will show you, what will happen when the Fibonacci retracement FAIL.