
Spinning Tops
Candlesticks that have a short body, with a long upper shadow and long lower shadow are called spinning tops regardless of whether they are black or white.
This pattern shows that the strength of the buyer and seller trader is equally strong in a session.

The small body shape indicates that the price movement is not much different between the opening and closing prices and the formed shadow indicates a struggle between seller and buyer traders but no one can win it.
Despite the change in the session open or close, the price continues to move significantly higher and lower.
Neither buyers nor sellers can win a trade, with a “standoff” result.
If spinning tops form during an uptrend, it indicates that there are not many buyer traders left and usually a price reversal is likely to occur.
If spinning tops form during a downtrend, it indicates that there are not many selling traders left and usually a price reversal is likely to occur.
Marubozu
With the characteristics of a candlestick that does not have a shadow either above or below
And depending on whether the body shape is black or white, the highs and lows are the same as the closing and opening prices.
For more details, please see the example of the Marubozu candlestick below.

White marubozu (white marubozu) is a candlestick with a long white body without shadow, meaning that the opening price is the same as the lowest price and the closing price is the same as the highest price.
This is a candlestick with a bullish trend, meaning that the buying trader is in full control of the trading session. This form is usually a sign of a bullish continuation or a bullish price reversal.
Black marubozu (black marubozu) is a candlestick with a long black body without shadow, meaning that the opening price is the same as the highest price and the closing price is the same as the lowest price.
This is a candlestick with a bearish trend, meaning that the selling trader is in full control of the trading session. This form is usually a sign of continued bearish strength or a bearish price reversal.
Doji
is a candlestick that has a very thin body shape because the closing price is the same as the opening price.
This candlestick shows no resistance from buyers or sellers for positioning.
The price value moves above and below the opening price during the course of the session, but closes near the opening price.
Neither buyers nor sellers failed to take control of the trading session, so the result was a tie.
There are 4 forms of Doji candlesticks.
The size of the shadow length either below or above the body varies, such as the shape of a cross (cross), inverted cross (inverted cross) or plus.
The word "Doji" refers to the singular and plural
 |
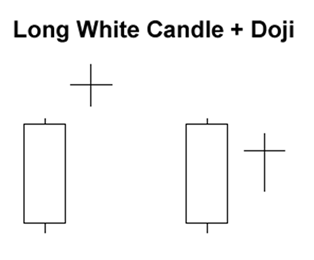
When the candlestick forms a doji, pay attention to the previous candlestick chart.
If the doji is formed after a candlestick with a long white body (such as a white marubozu), it means that the buyer trader has started to get saturated or overbought.
Because to make the price continue to move up it takes a lot of buyers and because the number has started to decrease then the selling traders will know this condition and get ready to take over the trading session and control the downtrend.
If the doji is formed after a candlestick with a long black body (such as a black marubozu), it means that the selling trader has started to become saturated or oversold.
Because to make the price continue to move down requires a lot of sellers and because the number has decreased, the buyer traders will know this condition and get ready to take over the trading session and control the uptrend. If you are a buyer, this is the right time to get the opportunity to buy at a low price.

Even though the price has fallen due to a lack of new sellers, further buying power is needed to confirm any reversal.
Look for a white candlestick to close above the opening price of a long black candlestick.
In the next class, we will learn about candlesticks more specifically.
Hopefully by the end of this lesson, you will be able to learn more about the different types of candlestick patterns and make trading decisions based on their explanations.